|
RELIGION
IN THE NEWS |
|
|
Table of Contents Spring 2004
Quick Links: From the Editor:
|
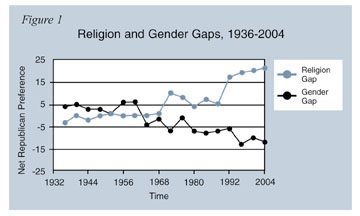
Gendering the Religion Gap by John Green and Mark Silk In the current election cycle, the “religion gap” has emerged as a new factor in American politics. In December and January, there was widespread news coverage of survey data, published in these pages and elsewhere, showing that citizens who claim to attend religious services regularly are now 50 percent more likely to vote Republican than those who say they don’t.#1 The data suggest that electoral politics in the United States has turned into something of a religious conflict, pitting—at least at the extremes—devout Republicans against secularist Democrats. In order to understand the nature of this conflict, however, it is important to view the religion gap through the lens of gender. When gender as well as religion is taken into account, the critical gap in partisan preference turns out to be between men who report attending services once a week or more often (“regular attenders”) and women who report attending less than once a week (“less attending”). The rest of the adult population—regular attending women and less attending men—are evenly divided, and could swing either way in 2004. The religion gap and the better-known gender gap both appear to be products of value conflicts that arose in the 1960s. Evidence of this can be seen in Figure 1, which uses a variety of survey data to trace the two gaps from 1936 to 2000.
In the New Deal era of the 1930s and the 1940s, neither worship attendance nor gender was a particularly important factor at the ballot box, but to the extent they mattered they showed the opposite of the situation today: Women were moderately more Republican than men, while those who attended religious services regularly slightly favored the Democrats. Women’s partisan preference switched dramatically in the 1964 election, going from six percent pro-Republican to four percent pro-Democratic. This presumably reflected concerns about GOP presidential candidate Barry Goldwater’s bellicose posture on the war in Vietnam and perhaps, in addition, support for the Great Society programs of President Lyndon Johnson. Over the next several elections women’s preferences bounced around from moderately to marginally pro-Democratic. But since the 1980 Carter-Reagan election, when they favored Carter over Ronald Reagan by seven percent, women have shown a solid and significant preference for Democrats, reaching a high point of 13 percent for Bill Clinton over Bob Dole in 1996. In 2000, the gender gap was about 12 percent. As for the religion gap, its watershed political moment was the 1972 McGovern-Nixon election, when regular attenders’ preference for the Republican candidate leaped from one percent to 10 percent. This is perhaps best understood as a choice by the traditionally religious in favor of Nixon’s “silent majority” and against the countercultural McGovernites. This pro-Republican religion gap shrank progressively during the two Carter campaigns, stabilizing through the 1980s in the mid-single digits. But then, in the 1992 election, it shot up from five percent to 17 percent, and has grown slowly and steadily ever since. Between the early and ongoing revelations of Bill Clinton’s personal immorality and the GOP’s steadfast embrace of the “traditional family values” agenda of the religious right, it is not hard to explain this persistent and growing gap.
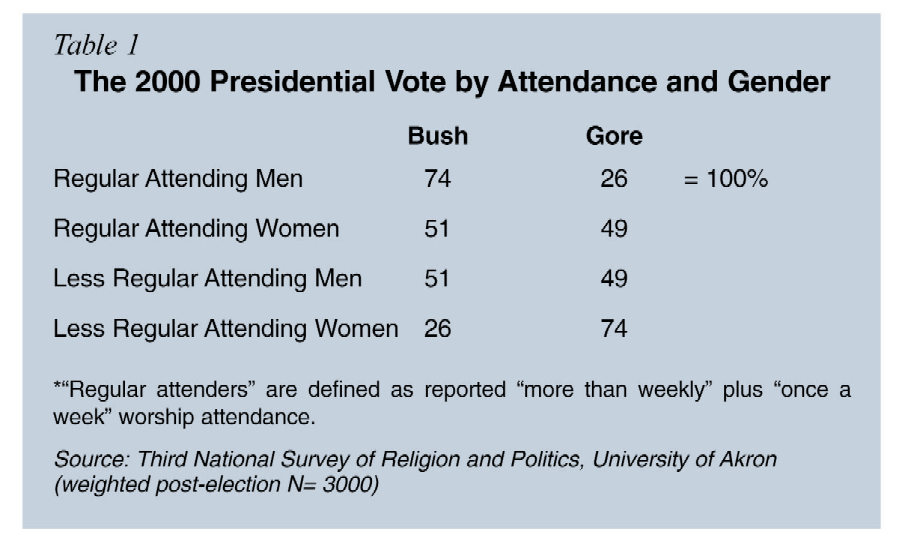
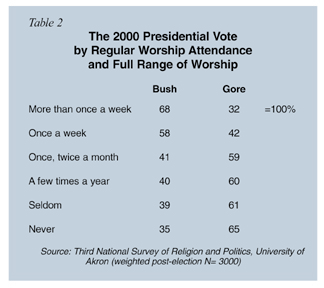
Table 1 looks at the combination of worship attendance and gender, revealing a strikingly symmetrical pattern. Three-quarters of regular attending men voted for Bush, while three-quarters of the less attending women voted for Gore. Just as fascinating are the two groups in the middle. The regular attending women and less attending men divided their votes almost evenly between Bush and Gore. Each category represented a hefty slice of the electorate in the 2000 election. The Bush-backing regular attending men made up 21 percent of voters, while the Gore-supporting less attending women were 24 percent. The evenly divided categories were somewhat larger, with less attending men at 26 percent and regular attending women—the plurality group—at 28 percent. Given how narrowly divided the electorate now appears to be, a small swing in just one of these large groups could determine the outcome of the 2004 election. What social realities lie behind these categories? Regular attenders tend to be older than their less regularly attending counterparts. They are also more likely to be married and live in the South. Regular attending women are more likely to be homemakers. But the regulars and less regulars differ little in education or income. Religious identity matters more than any of the above demographic differences. White evangelical Protestants and Mormons vote strongly Republican; the default setting for black Protestants and Jews is Democratic. Within some groups there are no gaps: Black Protestants and Jews vote Democratic regardless of attendance rates or gender. Elsewhere, a single gap applies. In the 2000 election, women who described themselves as “secular” were markedly more Democratic than men who did, though both were together at the bottom of the worship-attendance scale. The largest religious identity groupings do, however, contain both gaps. No religious group supported Bush over Gore more strongly than white evangelicals, yet while nearly 90 percent of regularly attending male evangelicals voted for Bush, only 77 percent of their female counterparts did. Regular attending mainline Protestants, the next most favorable group for Bush, showed an astonishing gender gap of 36 percentage points (92 percent for Bush among men versus 56 percent among women). Among regular attending Catholics, who were less pro-Bush overall, the gender gap was a much smaller 11 percentage points (63 percent for Bush among men versus 52 percent among women). Less attending men were substantially more supportive of Gore, with Catholics the most Democratic (48 percent), followed by evangelicals (39 percent) and then mainliners (26 percent). Among the less frequent attenders the gender gap was also substantial: 21 percentage points for Catholics, 20 for evangelicals, and 34 for mainliners. Indeed, the most consistent voting pattern across these denominational lines occurred among less attending women. Among them, 59 percent of the evangelicals, 60 percent of the mainliners, and 69 percent of the Catholics gave their votes to Gore. So much for the categories per se. In order to understand the political dynamics of this complex system it is necessary to look at cultural attitudes that cut across differences of gender, attendance, and religious identity—and push voters in one partisan direction or the other. These attitudes can be discerned from the survey data showing voters’ views of prominent interest groups. Political groups dedicated to promoting “traditional family values” united men and women according to level of attendance. Thus, 58 percent of regular attending men and 52 percent of regular attending women had a favorable view of the Christian Right. That contrasts with only about one-fifth of the less regular attending men and women. The same pattern held for views on pro-life and feminist groups, with some gender-based nuance: Regular attending women were modestly less “pro-life” than their male counterparts, while less regular attending men were less “feminist” than the comparable women. On the other hand, roughly 40 percent of both regular and less attending men felt positively about the National Rifle Association. But for both regular and less attending women the level of support was some 20 percentage points less favorable. Similarly, more than half of each category of women held a favorable view of teachers’ organizations, while both groups of men were some 15 percentage points less favorable. These competing axes of cultural conflict help explain the partisan breakdown of the four critical gender-and-religion categories. Regular attending men voted strongly Republican in large part because of their consistently conservative views on sexual morality, guns, and education. Their political opposites, the less attending women, were just as strongly Democratic because of their consistently liberal views on abortion, guns, and public education. The other categories were evenly divided at the ballot box precisely because of their crosscutting values. Regular attending women were pulled in a Republican direction by traditional morality, but their worries about guns and education pushed them in a Democratic direction. For less attending men guns and schools led toward the GOP—but hostility to morals regulation pointed to the Democrats. Because value conflicts create swing voters, regular attending white Catholic and mainline Protestant women and less attending white Catholic and evangelical men are likely to be up for grabs in 2004. Journalists interested in gauging how well the respective campaigns are doing with these swing groups might try interviewing at a few selected locations between, say, 10 o’clock and 12:30 on Sunday mornings. Check out The Home Depot and the local links, where many Catholic and evangelical men are rumored to be found bright and early on the Lord’s Day. If these weekend warriors like Kerry, look for a new administration in 2005. Then buttonhole women coming out of worship at Catholic and mainline Protestant churches. If these church ladies are tilting toward Bush, then the president will likely get a new lease on the White House.• Why Once a Week? Table 2 illustrates the relationships between self-reported worship attendance and the 2000 presidential vote that underlie the religion gap. It shows, first, that the relationship between attendance and the vote varies almost in lockstep: More than two-thirds of voters who claimed to attend worship more than once a week voted for Bush, while those who reported never attending worship voted nearly as heavily for Gore.
The table also shows that the break between Bush supporters and Gore supporters comes between “once a week” and “once or twice a month.” This once-a-week break point is consistent with other surveys. Why should there be such a difference in political behavior between those who say they attend religious services once a week and those fairly observant folks who say they attend once or twice a month? The simple answer is that for most Americans weekly worship attendance is normative: Telling a pollster that you attend weekly is a widely accepted way of saying that you are a religious person. In fact, recent sociological research has proven that many Americans “over report” their worship attendance (just as they “over report” their voting in presidential elections). For more than half a century roughly 40 percent of Americans have told the Gallup poll that they had been to worship services in the past week, but the real number now seems to be in the mid-twenty percent range. So the religion gap is as much about citizens’ religious self-perception, and self-presentation, as it is about their actual participation in congregational life. 1See John Green and Mark Silk, “The New Religion Gap,” Religion in the News (Fall 2003) <http://www.trincoll.edu/depts/csrpl/RINVol6No3/2004%20Election/religion%20gap.htm>. 2The data from 1936-1948 were estimated from Gallup surveys made available by the Roper Center at the University of Connecticut. Data from 1952-1996 were estimated from the National Elections Study, provided by the Interuniversity Consortium for Social and Political Research at the University of Michigan. The 2000 and 2004 data points come from surveys conducted at the University of Akron. (Because the Republicans are in power at this writing, the gaps are portrayed in net Republican advantage, with positive and negative signs, but the same patterns would obtain if the signs were reversed and the figures were portrayed as net Democratic advantage.) Further details available from John Green. 3Table 1 and much of the subsequent analysis uses the Third National Survey of Religion and Politics, conducted at the University of Akron in 2000. (Post-election sample weighted N=3000). This survey has detailed measures of religion.
|


